Every decision we make about our built environment, no matter how small, is an opportunity to provide better places for the people who inhabit them. Healthy Streets starts from this premise to develop a program that takes the smallest unit of cities, their neighborhoods, with the goal of improving the quality of life. Take note of this initiative that has already been applied in cities such as San Francisco, Barcelona, London, or Sydney.

What is Healthy Streets?
Healthy Streets is a method of policies and strategies created in 2018 by Lucy Saunders, a public health, urban planning, and mobility specialist. Through mapping data that measures ten indicators, areas are identified where changes should be made to achieve better scores. Usually, this analysis lasts for at least five years, the period in which the benefits of implementing strategic plans and roadmaps derived from each indicator begin to be observed.
The 10 indicators of a healthy city
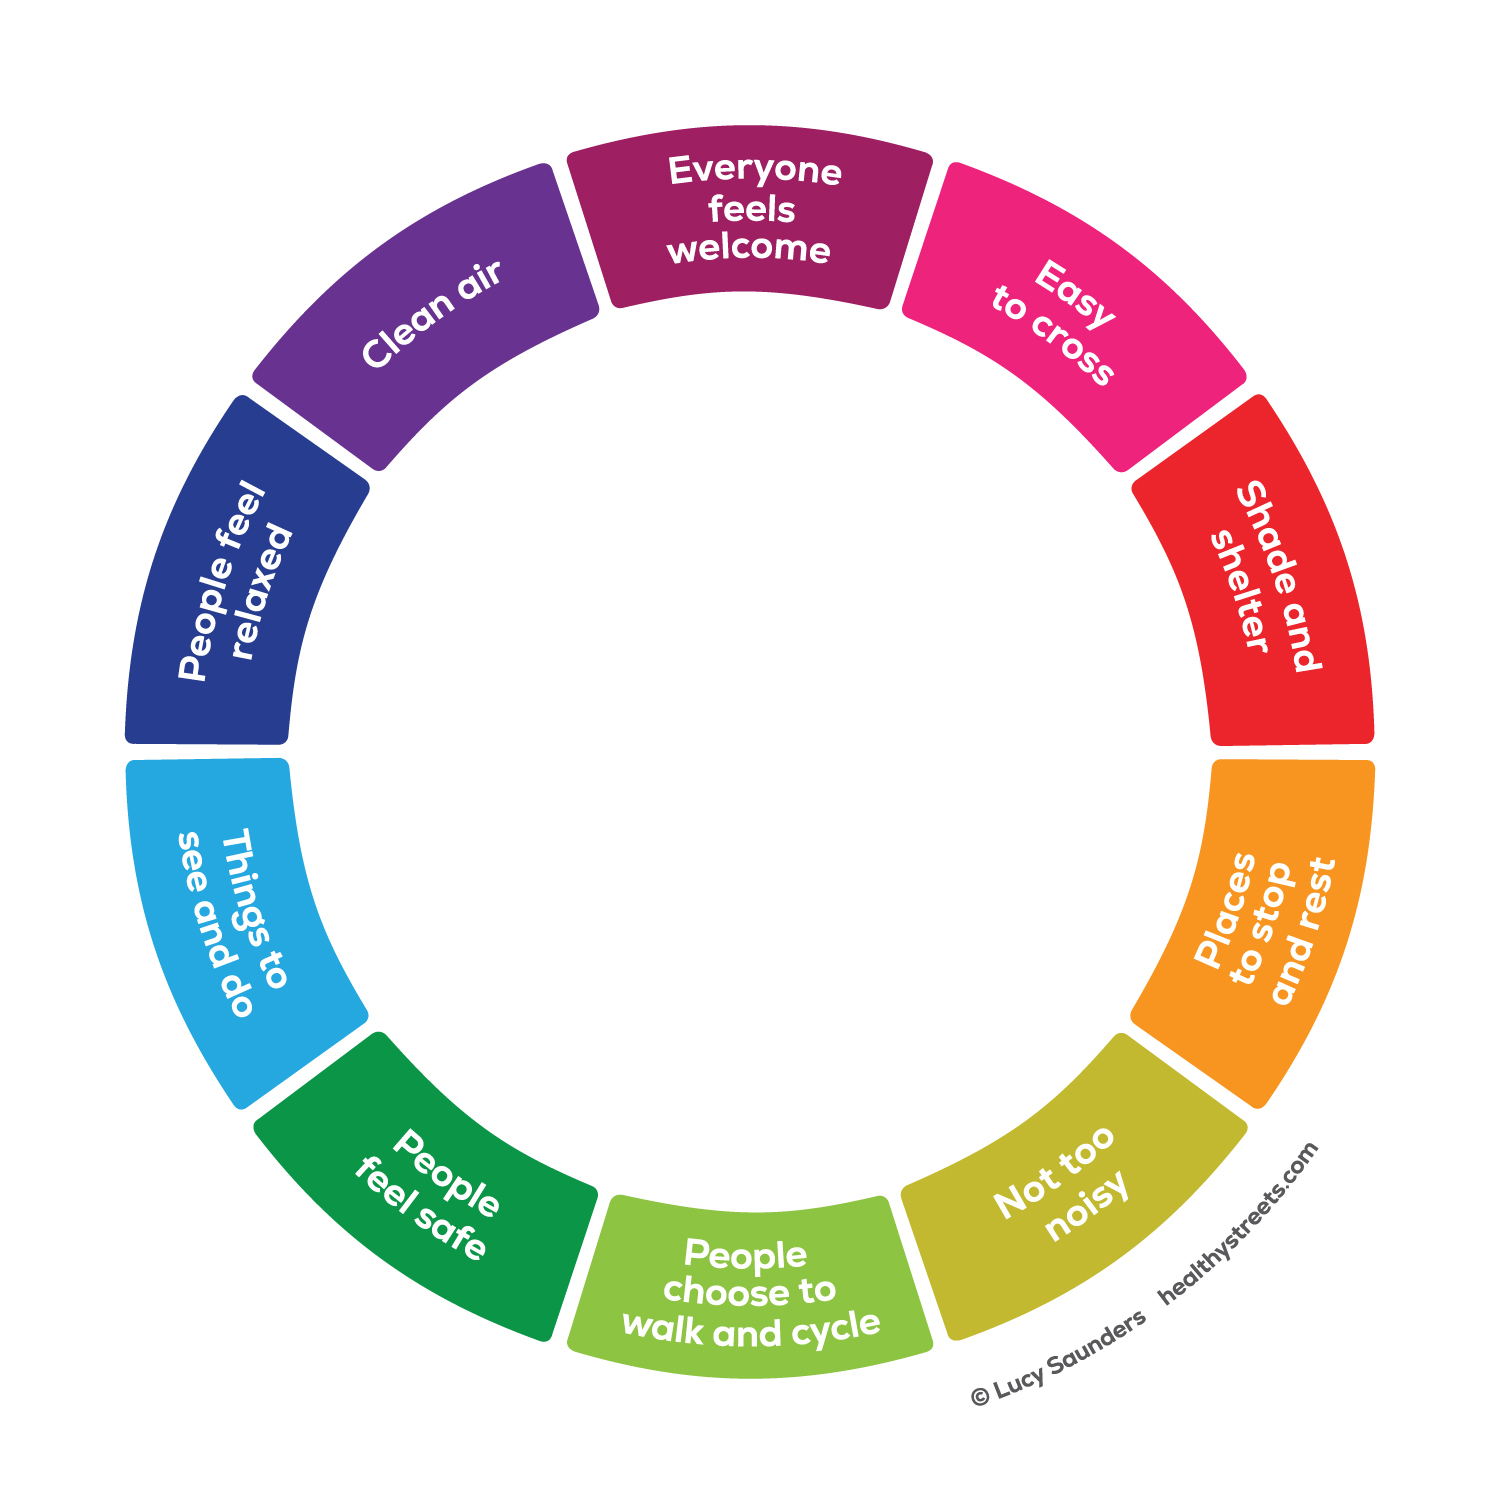
The approach to determining the quality of life in a neighborhood is based on ten evidences that describe an aspect of the experience of living in the streets. They gather ten keys that should be prioritized and balanced to promote environmental, social, and economic sustainability through the design and control of any city’s neighborhoods.
- Everyone feels welcome: spaces should encourage walking, staying, and interacting with others, thus helping us maintain good physical and mental activity.
- Easy to cross: eliminating architectural barriers and promoting accessibility, as well as minimizing excessive traffic.
- Shade and shelter: trees, awnings, colonnades… should ensure that one can move around regardless of the climate.
- Places to rest and stop: this will facilitate sustainable mobility for longer distances.
- Less noise: mainly, through the reduction of vehicular traffic.
- People choose to walk and cycle: for both short and long journeys, these options are more attractive than private cars.
- Safety: appropriate speeds within cities, attention to antisocial behaviors, lighting, and its distribution on the streets are key aspects of this indicator.
- Things to see and do: local shops and services and opportunities to interact with art, nature, and other people.
- More relaxation, less stress: the environment can make us feel anxious if it’s dirty or noisy, if it seems unsafe, if we don’t have enough space, or if we can’t easily move from one place to another.
- Clean air: minimizing pollution as much as possible helps reduce unfair health inequalities.

Well-being neighborhoods in London, Barcelona, and Sydney
London: 1,500 locations reviewed annually
In 2019, London concluded the verification of street designs and the evaluation of planning applications. Daily physical activity and lifestyle changes were included as key performance indicators and a surveillance system of 1,500 locations for annual review was established.

Thanks to these commitments, by 2041, 80% of journeys will be made by walking, cycling, or public transport, and the population will be encouraged to undertake at least 20 minutes of active transportation each day in the same year.
Barcelona: 32% Healthy Streets
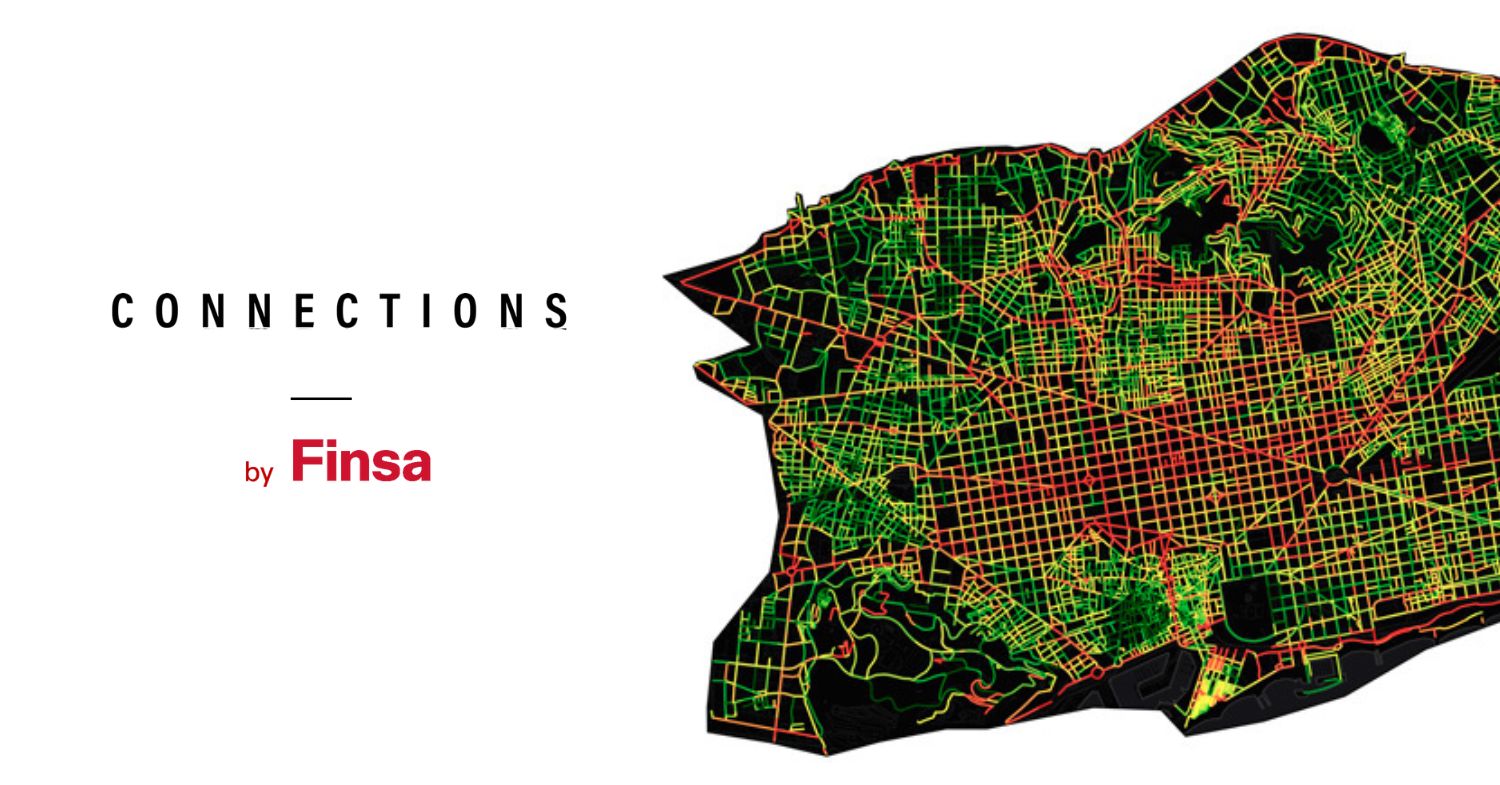
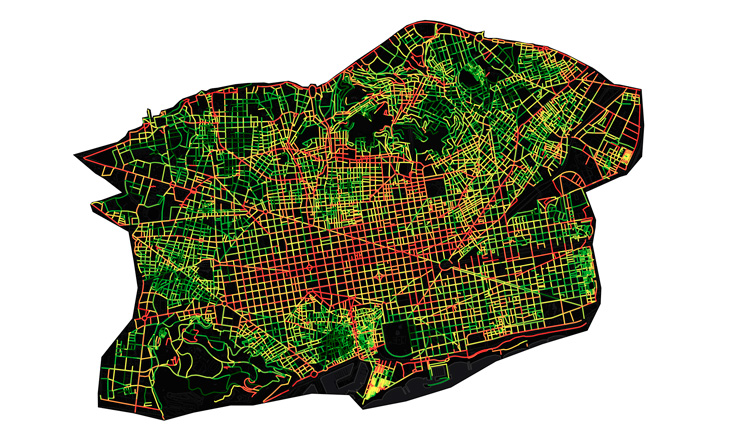
The index shows that, in Barcelona, 32% of the streets fall into the healthiest category, with a score above 59 out of 100 and shown in darker green on the map. This compares to 24% in London, despite being a much larger region than Barcelona, containing more suburban streets not necessarily designed with people’s needs in mind.
These maps detail the broader picture that a walk through the city center might hide from our view. Perhaps, more important than the relatively small difference between these two cities in terms of the healthiness of their streets is the fact that most neighborhoods in both cities (Barcelona and London) score between 40 and 60. There are few truly unhealthy streets, but there is still a long way to go before ensuring that one’s home, workplace, or journey on foot or by bike is carried out in a healthy environment.

Sydney: a tool to assess its design
The Australian city completed the Healthy Streets project with the publication of a tool to assess all its design parameters. Design, planning, engineering, public health, communications, and environmental officials learned the system and developed plans that they would then implement in their local organization.

Healthy Streets provides the complete data of the program’s application in Barcelona and the UK for free. To access it, simply send an email to contact@healthystreets.com.
Tools for designing Healthy Streets
The Healthy Streets methodology offers three types of resources on its website available to any professional interested in sustainable design:
- Indicators with data from New Zealand, Barcelona, and the UK.
- Custom tools for qualitatively assessing neighborhoods and conducting design checks.
- Practical guides that help change the urbanistic approach and allow for monitoring progress and the quality of data collection.

Were you aware of the Healthy Streets method? Will you consider it in your projects in neighborhoods and cities? Share your opinion on social media using the hashtag #ConnectionsByFinsa to connect with habitat professionals like you.


